

Price and Competition in Food Markets
Basic Economics. The notions of supply and demand are fundamental to economics. The general logic here is that consumers will be willing to buy a larger quantity of goods at a lower price than they would at a higher price. As we will see, this assumption is sometimes violated, usually when consumers use price as a cue to quality and assume that a higher priced product is better. Similarly, sellers are generally willing to sell a larger quantity when a higher price is offered. Thus, we have the traditional supply and demand curves:
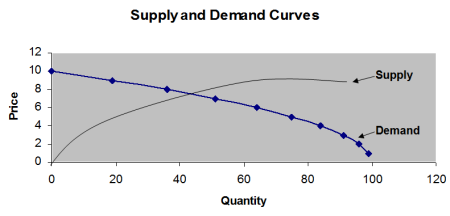
Several things are evident from this chart:
- Each curve—supply and demand—indicates the quantity supplied or demanded at the prices offered. At a price of $4.00, for example, buyers would be willing buy about 85 units. However, at that price, only about 10 would be supplied.
- Where the two curves intersect, the equilibrium, or market, price is found. The quantity supplied at that price is the same as the quantity demanded at that price—about $7.50 in this chart.
- When the market price changes—because of a change in supply—the demand curve is not directly affected. If the price decreases, there will be an increase in quantity demanded but not a change in overall demand.
- Supply and demand curves often have a curved—as opposed to straight line—shape since there is no reason why the same change in price—say, $1.00—will have the same impact at high or low prices. For example, if the price of heavy cream were reduced from $3.00 to $2.00 a pint, quantity demanded would increase. However, if heavy cream sells for an already low price of $1.00 per pint, reducing the price even further would have little effect. This product simply contains too many calories for consumers to consume more even if it were free.
As we will see in examining research on consumer response to price, real life demand is not always as smooth as it is portrayed in theoretical demand curves. For example, sharp changes may occur when certain “critical” price points are reached. Consider the following hypothetical quantities of cereal boxes demanded:
It is clear that the dramatic drop in quantity demanded as we go from $3.95 to $4.00 is likely not due so much to the small 5 cent increase in price as it is to our reaching a “critical” price of $4.00 that consumers are reluctant to pass. That is, suddenly when the price reaches $4.00, it appears as “expensive.” If we increase the price another 5 cents, the additional drop in quantity demanded is small.
Price elasticity refers to the extent to which quantity demanded is affected by changes in the price. By definition
% change in quantity demanded
Elasticity = ________________________________
% change in price
Research has found that at prices normally charged in supermarkets, the price elasticity appears to be around -2.0 for many different product categories. That is, if prices are raised by 1%, sales will tend to decline by 2%.
Demand Curves. Total demand for a product results from adding the demand for each consumer. Some consumers will have high levels of demand, or low elasticity, and others will be highly price elastic. As a practical matter, it is usually most convenient to consider total demand as the sum of demand from different segments. Here, again, certain groups of consumes will value the product more than others. For example, in the case of steak, followers of the Atkins diet will value the product highly. These consumers will buy large quantities even at high prices. Since they have already bought all they can eat anyway, they may not buy much more if prices are lowered. In contrast, those following a low fat diet may not buy much beef no matter how cheap it is. Certain consumers are very price sensitive. They will tend to buy whatever is cheapest—if beef is cheaper than chicken, they will buy beef, but they will not buy much beef if it is more expensive. Finally, the largest segment probably consists of consumers who are somewhat price sensitive. They will buy some beef at high prices, but they will buy increasingly more at lower prices.
Supply. In the short run, supply is determined by what is available. If there is a glut of beef, prices will come down, and prices will increase if there is a shortage. In the long run, producers can adjust their production levels. Often, adjustments take a long time. To increase production of beef, you first have to raise stock. You may also have to build barns or acquire more land to hold the livestock. By the time production has been increased, prices may be on the way down. It may also be difficult to decrease production since a lot of resources have already been invested in production capacity. If prices of wheat go down, it may be difficult for a farmer to sell land that he or she no longer finds useful to plant.
Costs come both in fixed and variable categories. Fixed costs are costs that are not affected by the quantity produced. The mortgage on a farm costs the same regardless of how much is planted, and the loan payments on manufacturing equipment are the same regardless of how much it is used. Variable costs, in contrast, depend on the quantity produced. If a farmer produces less wheat, he or she will need to buy less seed. Some costs are in a gray area. Labor costs may or may not go down with decreased production, especially in the short run. Because fixed costs cannot be changed in the short run, firms may find it optimal to produce a product even though it will lose money. If variable costs, but not all fixed costs, are covered, the firm will lose more by not producing. Even if revenue is less than variable costs, farmers may be forced to produce due to pre-existing contracts.
Changes in supply and demand. Supply may change due to changes in the market such as:
- The size of the current year’s crop.
- Changes in the population. As population increases, demand for certain products may change. Even if the overall population is not affected, there may be large changes in the sizes of different segments. For example, U.S. population growth has been modest, but Asian immigration has increased dramatically, creating more demand for rice and pork.
- Changes in income or wealth. During recessions, consumers tend to cut down on their spending. It is difficult to cut down much on basic food products, but people may reduce consumption of luxuries and upscale brands.
- Changes in tastes and preferences. The U.S. population has grown more diverse and many “ethnic” foods have spread to other groups. There is, for example, a large demand for Chinese and Mexican food among white Americans. This growth may happen at the expense of traditional foods such as potatoes and hamburgers.
- Changes in the prices of substitutable products. If there is an abundant harvest of corn, the demand for sugar is going to decline even if there is no change in sugar supply or the demand for sweeteners. Corn syrup can be substituted for sugar as a sweetener, so if this is more economical, fewer manufacturers will buy sugar.
- Future price expectations. If it is expected that a product will increase in time—e.g., if it is predicted that there will be a bad harvest next year—speculators may hold back inventory rather than selling it, thus decreasing supply.
Market/Clearing Prices. A market, or clearing, price is set when the market matches supply and demand. If the price is too low, more quantity will be demanded than what is supplied, and the price will rise. If the price is too high, there will be a surplus and the price will decline. This clearing price allocates the product to those who value it the most (though not necessarily to those who “deserve” it).
Macroeconomic Influences on Prices. A common concern in the U.S. and in many other countries is that food prices are too low. At market prices, it is complained, farmers will not be able to make a profit and therefore run a danger of going out of business. Sometimes, governments will attempt interventions to raise prices or otherwise affect farmers’ revenue. One method is a subsidy, or “negative tax” whereby farmers are given extra payments from the government. For example, at one time, certain chicken growers, for every dollar worth of meat they sold, received a subsidy of $1.01. Thus, the effective price paid to the farmer was $2.01. In this case, of course, this extra price was not passed on down the channel. As an alternative, a government may buy up product at the open market, thus increasing demand, until prices hit a desired level. Alternatively, supply can be curtailed by quotas—e.g., only certain farmers are allowed to grow a certain amount of tobacco, and there are limits on how much of certain products (e.g., sugar) can be imported. In certain countries and in war time, certain products may be rationed. Here, no matter how much someone is willing to pay, he or she can only buy a limited amount of scarce goods. Price controls, limiting the maximum that can be charged for a product, can also be imposed, but these have the very serious consequence that production will decrease—it will not be profitable to produce as much product as is demanded at the artificially low price. Shortages are then likely to occur.
Consumer Response to Price. Both manufacturers and retailers make decisions as to optimal prices to charge consumers. Ultimate price decisions in the United States are, of course, made by the retailer, but manufacturers make promotional and other decisions that influence retailer decisions.
Ways to Change Prices. One obvious way to increase the price of a product is to increase the “sticker” price—the price that is actually charged for a container. Consumers, however, often react strongly to such obvious price increases—especially if competitors have not yet raised their prices, too. Other methods have therefore been devised. To understand how these methods work, first consider the idea that
Resources Given Up
Price = -----------------------------------
Value Received
Increasing the sticker price changes the numerator—what the consumer sacrifices. Other approaches focus on the denominator. One approach involves reducing the quantity provided in a container. Instead of raising a sticker price of a can of coffee from $3.49, the content can be reduced from, say, 11 to 9 ounces. Alternatively, one can change quality. Candy makers, when the prices of chocolate went up, used less chocolate and more “gooey” stuff. Finally, terms and service can be changed. This usually does not happen in consumer food products, where this is not relevant. However, a seed or fertilizer store might stop giving farmers ninety interest free days to pay for purchases.
Price Discrimination. As we saw in our examination of components of the demand curve, some consumers value a product more than others and are willing to pay more. Marketers then are interested in getting each customer to pay as much as he or she is willing. It is infeasible to ask consumers how much they value a product and then charge that amount, but sneaky ways have been devised to charge certain customers more. In explicit price discriminations, only certain customers are eligible for a lower price—e.g., student or senior citizen discounts. More common is implicit price discrimination. Anyone who wants to can cut a coupon out of the newspaper, but not all customers bother. Products can be put on sale periodically. Those consumers who care more about saving money than getting their preferred brand will switch, but others will pay full price.
Consumer Price Response and Awareness. An interesting study showed that most consumers, in shopping for frequently purchased product categories, did not do much price comparison. Consumers, on the average, inspected only 1.2 items before making a selection, spending only twelve seconds before moving on. Only 21.6% claimed to have compared prices, and only 55.6% answered within 5% accuracy when asked about the price of the product they had just picked up. This seems to suggest that consumers to not pay much attention to prices. On the other hand, we know from scanner data that consumers respond a great deal to price changes. It appears that rather than looking at prices per se on every shopping occasion, consumers may check prices only periodically (say, every ten shopping times) or rely on cues in the environment—e.g., buy whatever brand is on sale. A study found that many consumers did, indeed, pay attention only to the fact that a product was on sale (the promotion “signal”). These consumers would select a brand regardless of whether the actual discount were small (e.g., 2%) or large—say 25%.
Odd-even Pricing. Most supermarkets tend to use the so-called “odd” prices—those ending in .99 or .95—rather than round dollar figures. Many believe that this practice is intended to make prices seem lower than they are. For example, $2.99 could be seen as “two dollars plus ‘change’” rather than “almost three dollars.” Research shows that consumers are slightly more likely to purchase at these odd prices, but the effect is not large. Odd prices may send a signal that a product is a “bargain.” This may be good for some low involvement products such as flour, but it may be bad for premium quality brands where an even price may signal higher quality. A premium wine may therefore be better priced at $28.00 than at $27.99. A study conducted in the 1970s showed that restaurant patrons at that time responded more favorably to odd prices when the price was less than $7.00 but better to even prices when the price was higher. Thus, the price of $4.99 should be chosen instead of $5.00 but $11.00 should be chosen over $10.99. (Adjusting for inflation, these figures should probably be roughly doubled today). Odd prices, by the way, are believed not to have been invented to deceive consumers. Early on, there was a concern that dishonest store clerks might not ring up purchases for customers who paid the exact amount due and did not ask for receipts. If the clerk had to give the customer change, he or she had to ring up the purchase to do so, however.
Estimating Consumer Willingness to Pay. It is extremely difficult to estimate how much a consumer will be willing to pay for a new product. Focus groups and questionnaires asking this question will generally not provide useful answers. People have difficulty determining how they would actually behave in a hypothetical situation. What they think and what they would actually do often do not “jive.” In practice, one of the few viable methods is experimentation—e.g., selling a product in certain test stores at different prices and seeing responses. One can test different price levels in a laboratory where consumers are asked to shop for a basket of goods, but this is a bit farther removed from reality. Conjoint analysis, a method where consumers rate a number of combinations of product attributes, including price (e.g., healthy, $2.99, poor taste vs. unhealthy, $3.99, superior taste) may be used. Here, the consumer rates the overall combination—how good is this offering?—and a statistical technique is then used to “decompose” the effects of the variables tested, including price. For existing product categories, it may also be possible to develop computer models based on scanner data and other market information.
Competition in Agricultural Markets. Farmers generally face commodities markets. A product produced by one farmer is considered essentially equivalent to a product of the same grade produced by another. Farmers are thus price-takers. They can sell all they can produce at the market price, but they have no individual bargaining power to raise prices. In the consumer goods markets, markets can be either competitive, monopolistically competitive, or oligopolistic. In an oligopoly, a few large manufacturers dominate. For example, in the cola drinks market, Coke and Pepsi have most of the power. Each will influence the market a great deal. If one raises prices, the other can raise prices, too, and not worry too much about losing market share. In categories where there are several large competitors, the market structure is monopolistic competition. There are, for example, numerous manufacturers of ice cream. If one lowers its price or introduces a new product, this may significantly affect sales of other brands. Certain large brands still have a great deal of bargaining power, however. Dreyers, for example, can charge a lot more for its ice-cream than a lesser known brand based on its brand image.